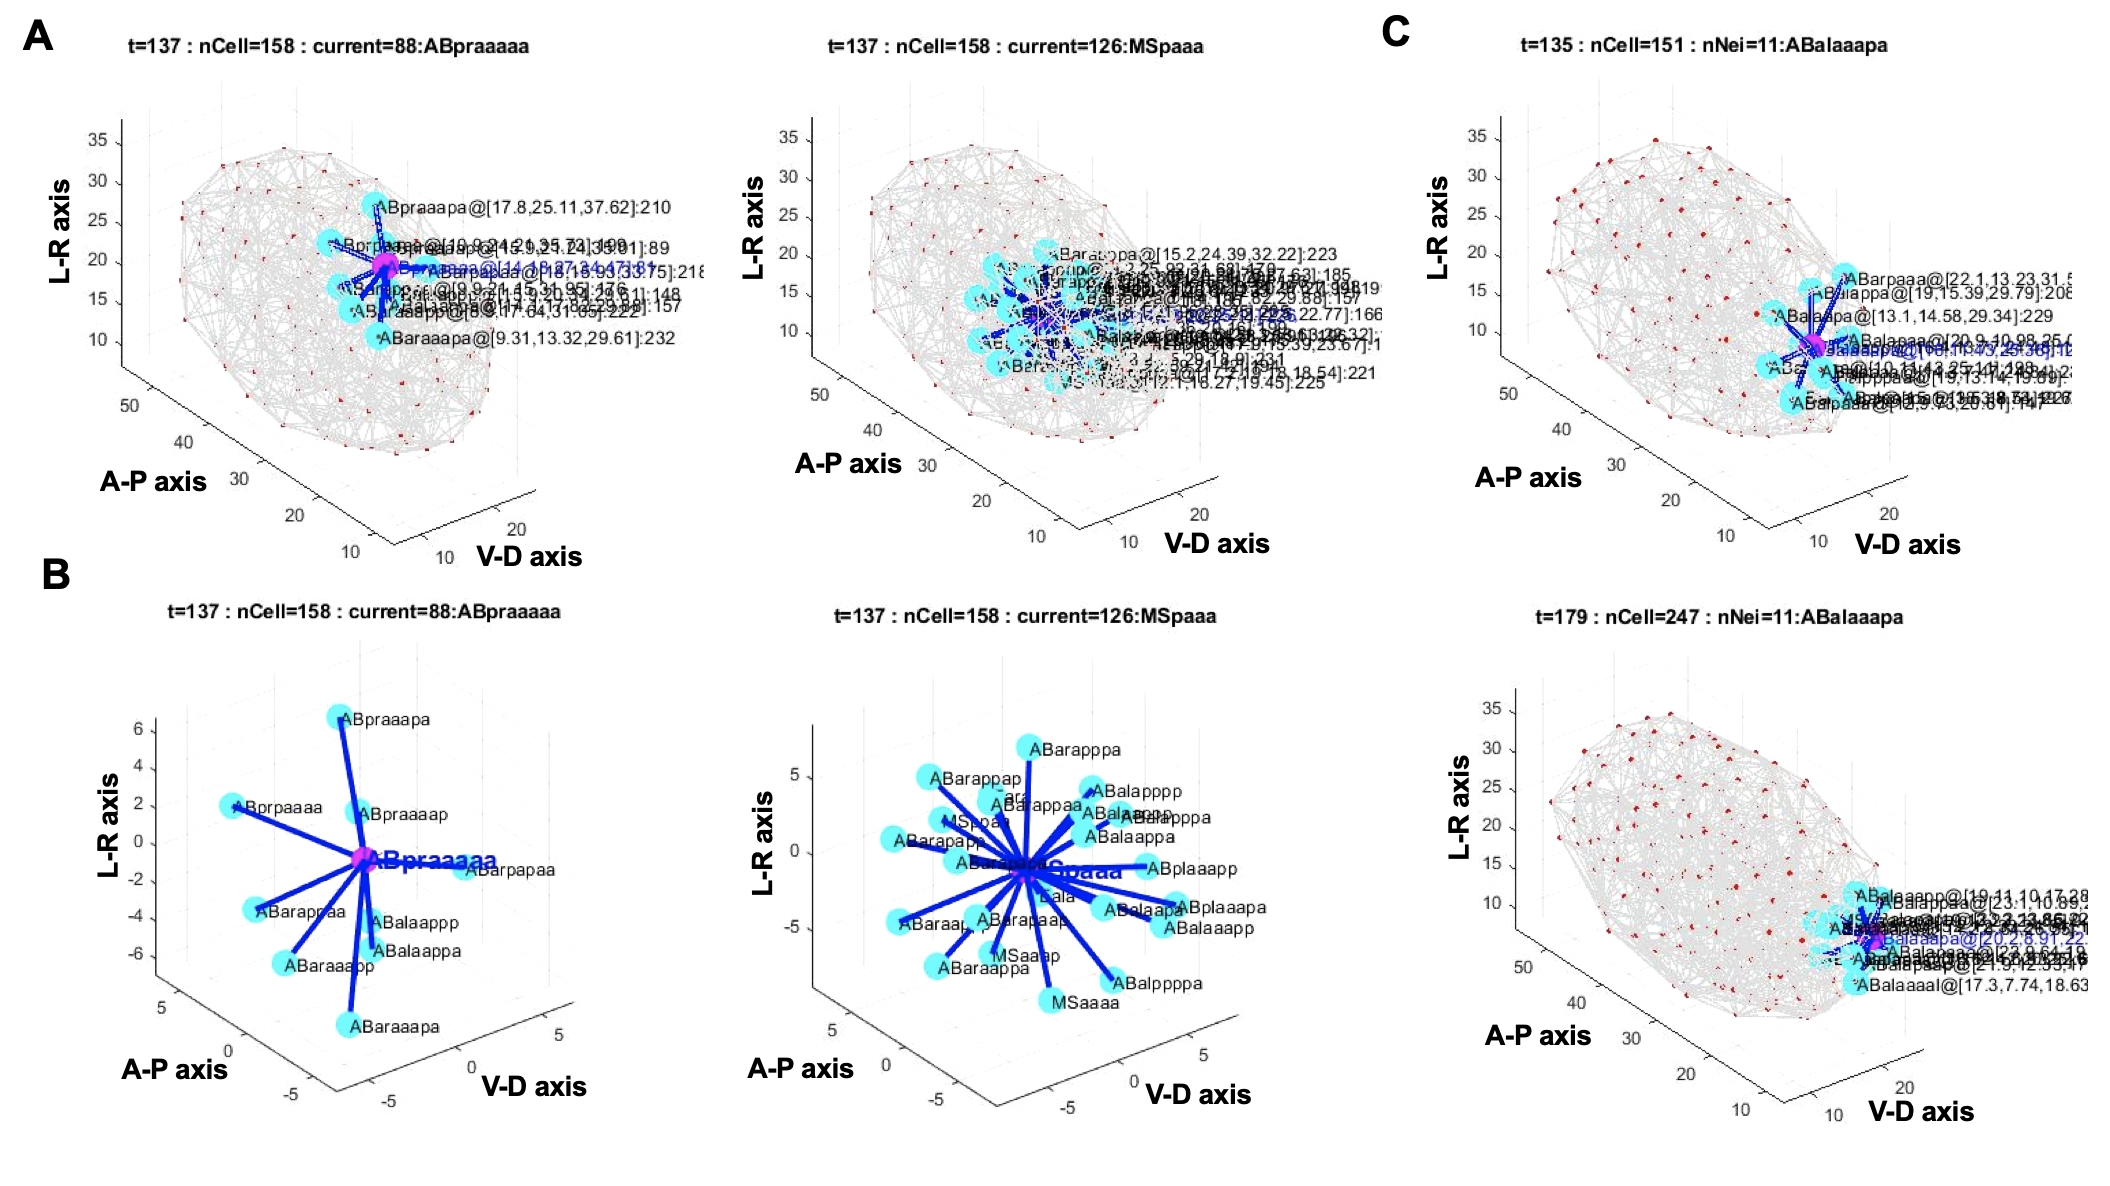
Supplementary Figure 3: Single cell level analysis can be achieved through the integration of gene expression profiles with cell spatiotemporal information in 3-dimensional Voronoi diagram. (A) Embryo cellular network were generated with 3-dimensional Voronoi diagram, where red dots represent cell nucleus and gray lines represent the identified direct cell-cell interaction relationships. The magenta color coded cell represents the current cell being tracked and analyzed. The cyan color coded cells represent all its interacting neighbors. At each embryo developmental stage, for each cell we identified its direct interacting nearest neighbors, calculated the distances, the angles, and counted the number of genes expressed in the cells. We assigned each cell in the network a ‘Unique Resource Link (URL)’ like address identifier, in the format of ‘cell_name @ x_coordinate.y_coordinate.z_coordinate : number of genes expressed’ for subsequent analysis. (B) An amplified view of (A) depicting the cell-niche interaction microenvironment. For example, the cells ‘ABpraaaaa’ and ‘MSpaaa’ (magenta color) interacts directly with 9 and 21 cells (cyan color) respectively at the embryo stage of 158 cells. (C) We performed in silico cell lineage tracing and generated the cell-niche microenvironment data for every cell at different developmental stages. For example, the cell ‘Abalaaapa’ and all its nearest neighboring cells showed varied spatiotemporal setting in geometrical and gene expression patterns.